
The Crease Report finds the best goaltending values on a given slate by looking at a goalie’s own metrics and the quality of team defense played in front of them. Team shot maps, shots against (SA), scoring chances against (SCA) and high danger chances against (HDA) are all weighed and considered to determine the best matchups. In addition to the individual goaltenders and their team defense, their opponent’s offense is examined as well, using the team shot map, shots for (S), scoring chances for (SCF) and high danger chances for (HDF). A teams’ xGF/60, expected goals for per sixty minutes and xGA/60, expected goals against per sixty minutes, will also be factored in. Ideally we’re looking for goaltenders that play on teams with a moderate amount of shots against but low amounts of scoring chances against and high danger chances against, and an opponent with high shot volume but low scoring chances for and high danger chances for. Statistics and images from hockey reference.com and hockeyviz.com.
Nashville Predators Goalies vs Anaheim Ducks
Juuse Saros: GS 52 30-19-3 SV% .923 GAA 2.47 SO 3 QS 34
David Rittich: GS 8 5-2-1 SV% .894 GAA 3.04 SO 0 QS 3
Juuse Saros has continued his stellar play for the Predators, he’s won five of his last seven starts, in four of those starts he allowed one goal or less and he’s made 35+ saves in two of his last three games. Saros has played every other game over the last week so pay attention in case Rittich gets the nod, there’s a significant drop off in skill level between the two.
Regardless of who gets the start though, Nashville typically puts their netminders in the best position to succeed. Their defense ranks in the bottom third of both SCA 22nd (1285, 20.72/game) and HDA 30th (345, 5.56/game). Despite the limited number of quality scoring chances they give up, the Predators still allow an above average amount of shots against, 14th (1965, 31.69/game). This all contributes to the Predators ranking 26th ranking of xGA/60 (123.1) highlighting how effective their team defense is. You can see from their shot map they allow few scoring chances from the slot or near the crease.

Anaheim is middle of the pack when it comes to their shot volume 16th (1898, 29.65/game) and just as average when it comes to their scoring chance numbers, 18th in SCF (1310, 20.46/game) and 16th in HDF (399, 6.23/game). Their xGF/60, 15th (133), ranking is reflective of those numbers. Their shot map shows how they are getting off a heightened amount of shots from down near the goal line and while they do get some good shots off from the low slot not an exceptional amount to be of concern.
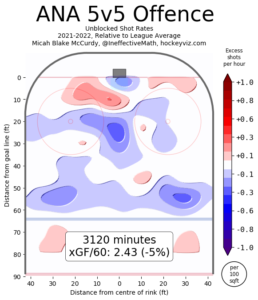
Nashville’s suppressive defense is exactly the type of defensive system that can easily stifle a Ducks offense that seems to prey on weaker teams and struggle when competing against teams with more talent. The Predators do an excellent job keeping their opponents from getting chances precisely where Anaheim is most successful scoring, the low slot.
Minnesota Wild Goalies vs Vegas Golden Knights
Cam Talbot: GS 37 24-12-1 SV% .907 GAA 2.92 SO 1 QS 21
(Since this article was written Kaapo Kahkonen has been traded to San Jose and Marc-Andre Fleury was acquired from Chicago. However Cam Talbot *should* be tonight’s starting goaltender.)
The Wild goalkeepers are nearly identical in their performances this season, Talbot is technically the starter playing two games to Kahkonen’s one but Kahkonen has been just as effective if not slightly better. Given today’s trades, expect Talbot in goal for tonight, the matchup will be high risk, high reward variety.
Minnesota is the best in the league at limiting scoring opportunities for their opponents, they rank 32nd in SCA (1116, 18.6/game) and 32nd in HDA (306, 5.1/game) so their goalies rarely face many dangerous scoring chances. However that doesn’t mean they face a lack of shots, the Wild allow over thirty shots against, 24th (1909, 31.81/game), per contest. All of this adds up to their 31st ranking in xGA/60 (112.4). From their shot map it can be seen that they keep opponents out of the slot and away from the crease, forcing most shots to come from out by the point.

This matchup pits strength against strength as the Golden Knights are one of the most dangerous teams offensively. Vegas ranks 5th in SCF (1510 23.59/game) and 1st in HDF (504, 7.87/game). With numbers like that it’s no surprise their shot volume 7th (2168, 33.87/game) is among the league’s best. Their 3rd place ranking in xGF/60 (153) is supported by those scoring chance and shot numbers. By the looks of their shot map they get an exorbitant amount of shots in the low slot and near the crease.

There is an obvious element of risk starting a netminder facing one of the most effective offenses at generating pressure and scoring chances but with such a smothering defense in front of him the odds of success increase substantially. This play isn’t for the faint of heart but with the potential of minimal ownership and one of the best ceilings on the slate, there’s a good chance this play finishes in the money.
Dave Leonard is our Lead Fantasy Writer at HW Hockey
For more Flyers coverage, follow and subscribe to High & Wide Hockey on Facebook, Twitter, and Youtube!
About the Author
Discover more from HIGH AND WIDE HOCKEY
Subscribe to get the latest posts sent to your email.