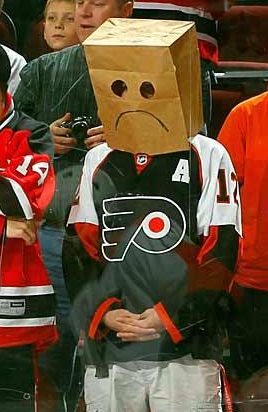
If you are a glutton for punishment and are still tuning into the Flyers games these days, not only will you enjoy this article, but you also don’t need numbers to tell you it has been ugly.
You don’t need analytics to tell you that the Flyers seem to be at rock bottom, though they somehow find a way to go lower with each passing game. If you did stop watching the games, you can just check twitter and see the #BroadStreetBag movement going on amongst the fanbase.
Two games after firing Head Coach, Alain Vigneault, the Flyers continue to sputter, bringing their losing streak to a staggering 10 games. They can’t make a simple breakout pass, they don’t support each other in any zone, there is constant confusion in the D zone, they are a slower team playing a heavy dump and chase system with no purpose, there is no creativity being shown offensively, players are showing little to no confidence in their game, and the power play might as well have you and me on it.
Long story short, the Flyers are a downright mess and everyone knows it. While I have some opinions on why that is the case, that is a story for another time. Right now, I want to look at just how bad this 10 game losing streak has been. How does it stack up over the past 10 years? This is where the analytics can help us.
Over the past 10 seasons, there have been 18 cases of a losing streak lasting 10 or more games. The Flyers have had 2 such streaks, one in 2017, and of course this current skid. Also of note, and a stat that I am sure will surprise precisely zero Flyers fans, Philadelphia unceremoniously appears as the slump busting team 6 times out of the other 16 occurrences. The only other team to appear more than once was San Jose, who was the losing team twice to bring an end to the cold streaks.
The 18 slumps involve 10 different teams, including some impressively bad teams. This Flyers team was revamped in the offseason with new blood, a presumed stronger defense corps, and an added veteran presence with the expectation that they would be competitive and ultimately a Playoff team. Surely, they cant be as bad as the Buffalo Sabres were last season, right??! Well you might want to look away at what I’m about to show you… and don’t call me Shirley.

As evidenced in the chart above, the Flyers have the 2nd worst expected goals percentage, 3rd worst Corsi percentage, and have allowed the most goals per 60 among their grave counterparts. While 9 streaks have gone longer than their current one, arguably nobody has performed worse.
Only one of these teams has made the playoffs in the season they posted their slumps. That team was the 17-18 Flyers (read into that at your own peril). The others came no where close, though shoutout to the very unlucky 12-13 New Jersey Devils for losing 10 straight, despite dominating play. The 14-15 Buffalo Sabres, 19-20 Detroit Red Wings and the 20-21 Sabres, who appear closest on this list to the current Philadelphia Flyers, finished their seasons 23-51-8, 19-45-5 and 15-34-7, respectively, easily placing dead last in the NHL standings those seasons.
Make no mistake about it, the Flyers are playing historically bad hockey. When the Flyers flipped the script in 17-18, as surprising and impressive of a turnaround it was, they were at least playing somewhat close to break even hockey during their losing streak. The same can not be said this time. The only thing I can say is… we’re witnessing history?
If you are looking for a little hope in this skid ending, half of these teams did find a way to win in their 11th game, while another 7 got in the win column by their 13th try. After tonight’s matchup with Vegas, the Flyers have dates with the Coyotes, Devils, Canadiens, and Senators. Not exactly what you would call a juggernaut lineup.
Having said that, they will still have to find a way to drastically change their game because as these numbers show, Philadelphia is not playing well enough to best anybody right now.

- Stats are from evolving-hockey.com and hockey-reference.com
Paul Pollock is Head of HW Analytics Department
Listen to High and Wide Radio on Apple Podcasts or Spotify
For more Flyers coverage, follow and subscribe to High & Wide Hockey on Facebook, Twitter, and Youtube!
Discover more from HIGH AND WIDE HOCKEY
Subscribe to get the latest posts sent to your email.